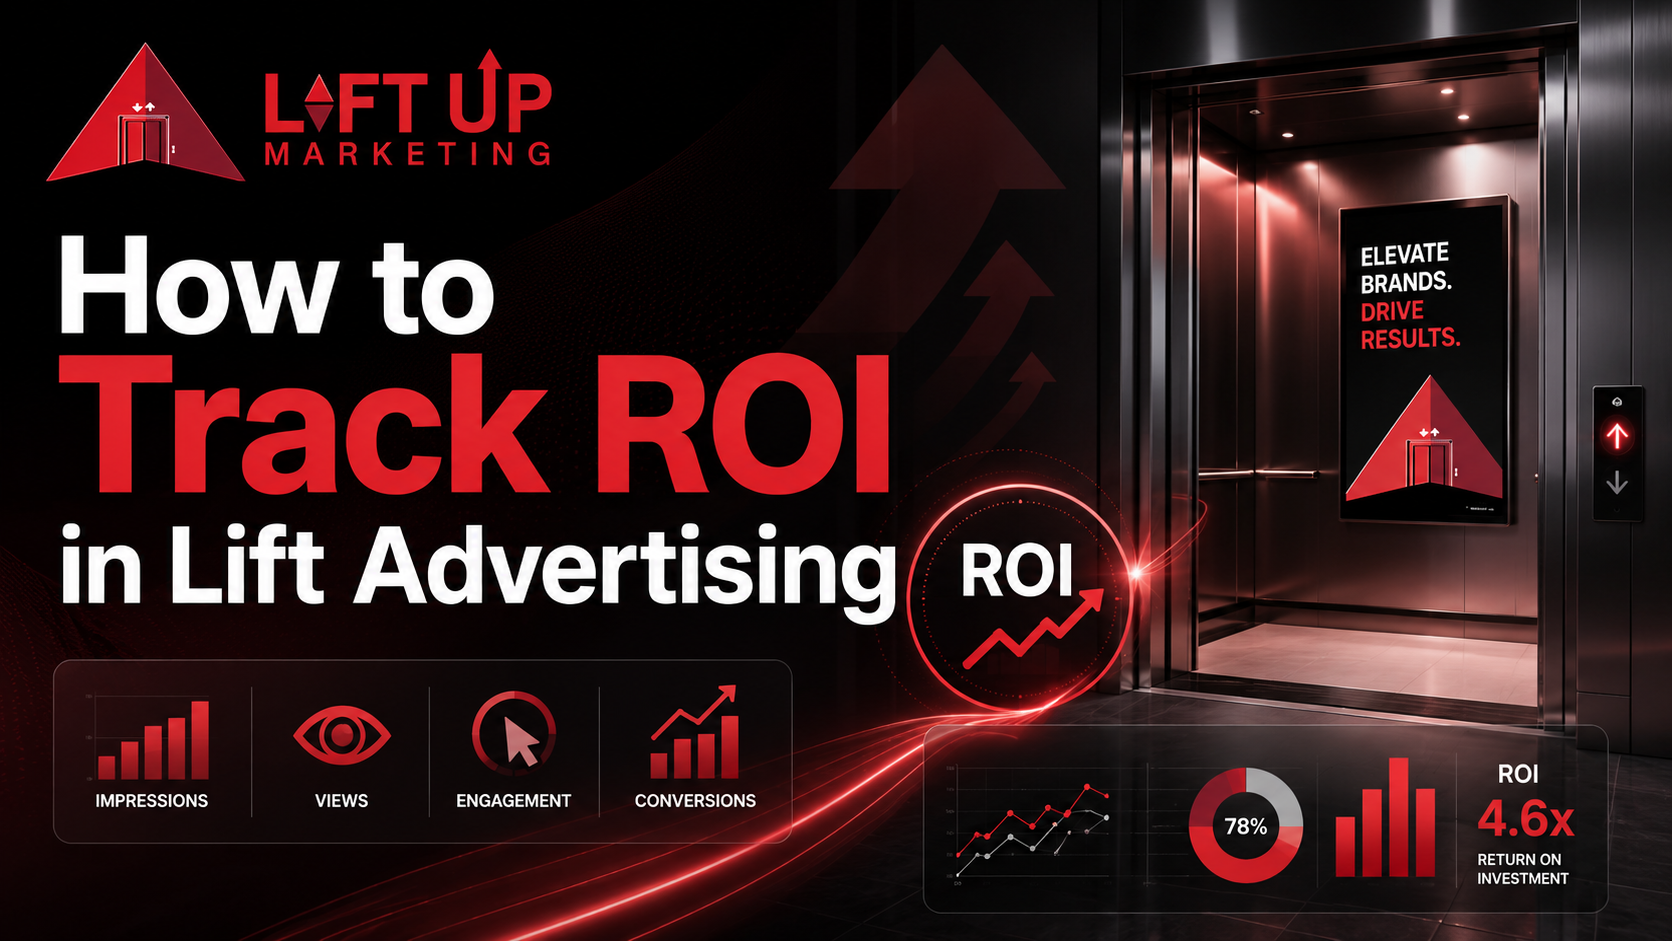
Can you track the ROI of elevator advertising? Yes — and with more precision than most outdoor media. The most reliable methods for offline conversion tracking in lift advertising include unique QR codes per campaign, dedicated promo codes, trackable phone numbers (call tracking), UTM-tagged landing pages, and footfall attribution surveys. When combined, these tools give you a clear, quantifiable picture of campaign performance — far beyond what a typical hoarding or newspaper ad ever could.
If you’ve ever been in a marketing budget meeting and someone said “we can’t really measure offline ads, so let’s just put it all in Meta” — this post is for you.
That assumption costs brands lakhs every year. Not because offline advertising doesn’t work, but because nobody taught them how to track offline marketing campaigns properly.
At LiftUp Marketing, we run lift advertising campaigns across residential societies in Tier 1 and Tier 2 Indian cities. And one of the first questions every serious business owner asks us is: “How will I know if this is actually working?”
Fair question. Let’s answer it completely.
Why Measuring ROI in Lift Advertising Is Actually Easier Than You Think
Here’s the thing most agencies won’t tell you: elevator advertising has a structural measurement advantage that most outdoor formats don’t.
Think about it. A billboard on a highway is seen by thousands of anonymous, fast-moving commuters. A newspaper ad sits among 30 other ads on the same spread. A social media ad competes with Reels, DMs, and memes for 1.2 seconds of attention before the scroll.
A residential lift ad? It’s a captive, enclosed, forced-attention environment.
Industry Insight: The average elevator ride in a mid-rise residential building lasts between 30 to 90 seconds. During this time, there are zero competing stimuli — no other ads, no mobile distractions (often no signal either), and no way to scroll away. Compare this to the average digital display ad view time of 1.7 seconds (Source: Microsoft Advertising research). The attention delta is enormous.
That captive dwell time is exactly what makes offline conversion tracking in lift ads not just possible — but surprisingly precise.
The Measurement Problem With Most Offline Marketing
Before we get into solutions, let’s acknowledge the real challenge.
Traditional offline advertising — hoardings, flyers, newspaper inserts, radio spots — suffers from what marketers call the “dark funnel” problem. Someone sees your ad, thinks about it for a week, then Googles your brand name and converts. Your analytics show “organic search” as the source. The hoarding gets zero credit.
This isn’t a flaw in the ad. It’s a flaw in the attribution model.
The good news: smart offline tracking techniques eliminate most of this dark funnel, especially for a contained medium like elevator advertising where you control the ad environment, the audience, and the call-to-action placement.
5 Proven Methods to Track Your Lift Ad Campaigns
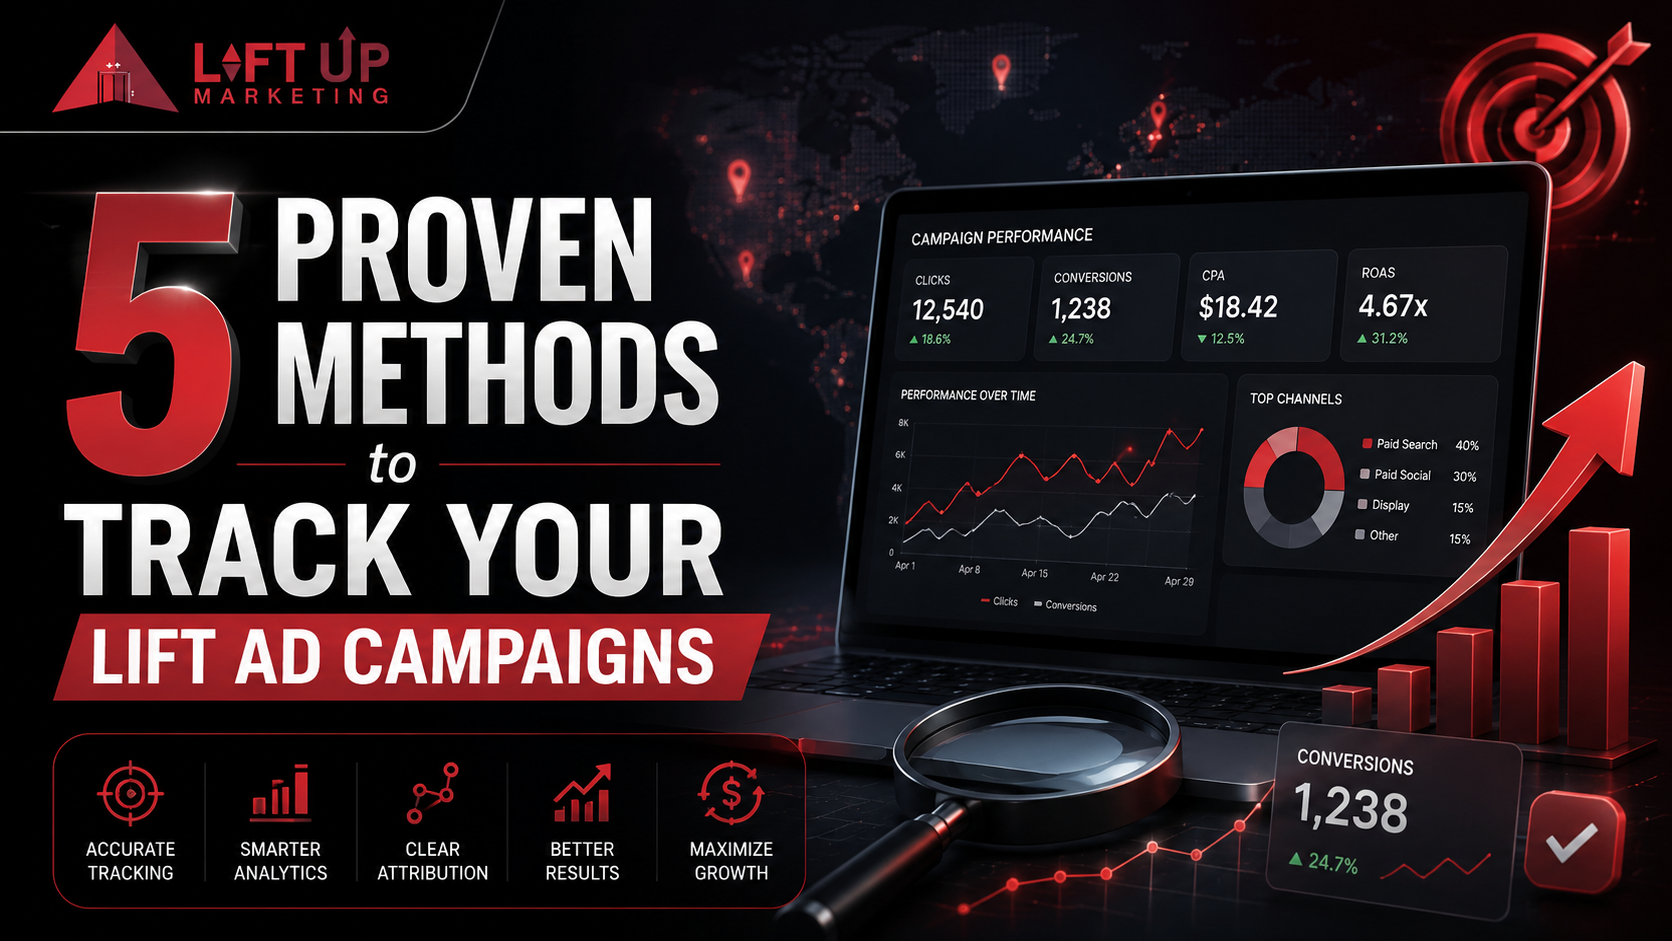
1. QR Code Tracking — The Most Powerful Tool in Your Arsenal
QR codes aren’t new. But the way most brands use them is wrong.
Slapping a generic QR code that leads to your homepage tells you almost nothing useful. What you need is campaign-specific, trackable QR codes — each one unique to a particular building cluster, campaign period, or creative variant.
Here’s how a well-structured QR tracking setup works for lift ads:
Step 1: Create a unique shortened URL for each campaign (e.g., using Bitly, Rebrandly, or a custom domain shortener).
Step 2: Append UTM parameters to the destination URL so Google Analytics captures the source precisely.
Step 3: Each QR code generated from this link tracks: number of scans, time of scan, device type, and subsequent on-site behaviour.
Step 4: Set up Goal Tracking or Conversion Events in GA4 so you know exactly how many QR scans resulted in a purchase, form fill, call, or trial signup.
Real-world QR code marketing example: A D2C skincare brand running a campaign across 200 societies in Pune used unique QR codes per ward cluster. Within 6 weeks, they attributed 1,840 verified scans directly to the lift campaign — with a 14% conversion-to-checkout rate on the landing page. That’s measurable, accountable, and comparable to any digital channel.
Pro Tip from LiftUp Marketing: Always pair your QR code with a time-limited offer on the landing page (“Scan now for 20% off — offer valid till [date]”). This creates urgency and dramatically increases scan rates while making attribution crystal-clear.
2. Promo Codes — The Simplest Offline Conversion Tracking Method
If QR codes are the precision rifle of offline tracking, promo codes are the dependable pistol — simple, effective, and easy for your customer to use.
Here’s how to use promo codes for marketing attribution in a lift campaign:
- Assign a unique promo code per campaign (e.g.,
LIFT20,SOCIETY25,PUNE-LIFT) - Print it prominently on the lift ad creative
- Track every redemption in your CRM, POS system, or e-commerce backend
- Calculate: Total Revenue from Code ÷ Campaign Cost = ROAS (Return on Ad Spend)
The beauty of promo codes is that they work for any business type — retail, SaaS, food & beverage, real estate, healthcare, education. Anyone with a transaction system can use them.
What to watch for: Promo code leakage (people sharing codes online). To minimise this, keep codes alphanumeric and avoid posting them on any digital channel during the campaign period. If a code does leak, it actually tells you something positive — your lift ad generated enough buzz that residents shared it voluntarily.
3. Dedicated Trackable Phone Numbers (Call Tracking)
For service businesses — think interior designers, real estate agencies, local clinics, coaching institutes, home repair services — the primary conversion action is a phone call, not a website visit.
This is where call tracking becomes your primary offline conversion metric.
The setup is straightforward:
- Use a virtual number service (like MyOperator, Exotel, or CallHippo — widely available in India) to generate a campaign-specific number
- Display only this number on your lift ad — not your regular business number
- Every call to this number is automatically logged: call time, duration, caller location, and whether it was answered
- Your tracking dashboard gives you a direct read on how many leads your lift campaign generated in real time
This method is especially powerful when combined with IVR scripts that ask “How did you hear about us?” — adding a qualitative layer to your quantitative data.
4. UTM-Tagged Landing Pages + Google Analytics
Even if your lift ad doesn’t use a QR code (some formats use text URLs or verbal CTAs), you can still track digital uplift from offline exposure using dedicated campaign landing pages.
The logic is simple: create a URL that exists nowhere else — not linked from your main site, not indexed by Google, not shared on social media. It’s only visible if someone types it from your lift ad.
Any traffic to this page = direct attribution from your elevator campaign.
Pair this with GA4’s Acquisition reports and you get:
- Sessions generated
- Average session duration (engagement quality)
- Goal completions (form fills, calls, purchases)
- Device breakdown (mobile vs. desktop)
- Geographic data (which society clusters are converting more)
This approach also captures the delayed conversion effect — someone who sees your ad on Monday but visits your landing page on Thursday. Traditional attribution would miss this; a dedicated URL catches it cleanly.
5. Footfall & Survey-Based Attribution
This is the most qualitative of the five methods, but for businesses with physical locations (retail stores, restaurants, clinics, showrooms), it’s invaluable.
How it works:
Train your front desk or billing staff to ask one simple question: “How did you first hear about us?”
Log responses in a simple sheet or CRM field. Over a 4–8 week campaign period, the data becomes statistically significant. If 22% of new walk-ins mention “I saw your ad in my building’s lift,” you have a direct footfall attribution number.
You can also run geo-targeted surveys via WhatsApp or SMS to residents in buildings where your lift ads are running — asking about brand awareness and purchase intent before vs. after the campaign.
Comparing Your Tracking Options: A Quick Reference
| Tracking Method | Best For | Complexity | Attribution Accuracy | Cost |
|---|---|---|---|---|
| QR Code + UTM | E-commerce, apps, digital-first brands | Low–Medium | High | Low |
| Promo Codes | Retail, F&B, D2C, any transactional business | Very Low | High | Negligible |
| Call Tracking Numbers | Services, clinics, real estate, local trades | Low | Very High | Low–Medium |
| Dedicated Landing Pages | All business types | Medium | Medium–High | Low |
| Footfall Surveys | Physical stores, restaurants, showrooms | Low | Medium | Negligible |
Our recommendation: Use at least two methods simultaneously — one digital (QR/UTM) and one transactional (promo code or call tracking). Cross-referencing both gives you a more complete and defensible ROI picture.
![]()
The Marketing ROI Metrics You Should Actually Be Tracking
Once your tracking is live, here’s what to measure — and what it actually means:
Core Marketing ROI Metrics for Lift Ad Campaigns
1. Cost Per Impression (CPM) Total impressions are estimated based on the number of unique residents in the buildings you’re running ads in, multiplied by average lift usage frequency (typically 3–5 times per day per adult resident). This gives you a baseline CPM to compare against digital channels.
2. Cost Per Scan / Cost Per Click (Offline CPC) Total campaign cost ÷ number of QR scans = your offline CPC. For context, Meta Ads in India currently average ₹8–35 per click depending on industry. A well-placed lift ad in a premium society typically delivers scans at a fraction of this — with significantly higher purchase intent.
3. Conversion Rate from Lift Campaign Traffic Sessions from campaign URL ÷ Goal completions = Conversion Rate. Benchmark against your overall website conversion rate. Lift campaign traffic typically converts higher because the audience is pre-qualified by geography and socioeconomic profile.
4. Revenue Attributed / ROAS The cleanest number for leadership discussions. Total revenue tagged to promo code or campaign URL ÷ Campaign spend = ROAS. Anything above 3x is strong for a new campaign; 5x+ is excellent.
5. Brand Recall Lift Run a simple WhatsApp poll in the target society’s resident group before and after a 4-week campaign. Ask: “Have you heard of [Brand Name]?” The delta in positive responses = your brand recall lift percentage.
LiftUp Benchmark Data: Across campaigns we’ve run in gated residential communities in Pune, Mumbai, and Hyderabad, brands using QR + promo code tracking consistently report 3.2x to 6.8x ROAS for campaigns targeting premium societies with 200+ flats. The top performers were FMCG, EdTech, and hyperlocal service businesses — categories where the residential audience is the primary buyer.
Lift Ads vs. Other Offline Channels: An Honest Comparison
| Format | Avg. Attention Time | Audience Targeting | Trackability | Monthly CPM (India Est.) |
|---|---|---|---|---|
| Residential Lift Ad | 30–90 seconds | High (society-level geo + demographic) | High (QR, promo, call) | ₹8–20 per 1,000 impressions |
| Roadside Hoarding | 1–3 seconds | Low (anonymous commuters) | Very Low | ₹25–80 per 1,000 impressions |
| Society Gate Banner | 2–5 seconds | Medium (residents + visitors) | Low | ₹15–40 per 1,000 impressions |
| Newspaper Insert | 3–8 seconds | Medium (city/zone-level) | Low (code-based only) | ₹30–100 per 1,000 impressions |
| Digital Display Ad | 1.5–2 seconds | High (intent-based) | Very High | ₹15–60 per 1,000 impressions |
CPM estimates based on Indian market data for Tier 1 cities. Actual costs vary by city, format, and vendor.
The numbers tell a clear story: elevator advertising delivers the longest attention time of any offline format, at competitive or lower CPMs — while offering trackability that rivals many digital channels when set up correctly.
Common Mistakes That Ruin Offline ROI Tracking (And How to Avoid Them)
Mistake 1: Using the same QR code for multiple campaigns or buildings. Fix: One unique code per building cluster per campaign period. No exceptions.
Mistake 2: Sending QR traffic to your homepage. Fix: Always send to a dedicated campaign landing page with a single, clear CTA. Every extra click you force costs you conversions.
Mistake 3: Not setting up conversion goals before the campaign launches. Fix: GA4 goals must be live before Day 1. You cannot retroactively track conversions.
Mistake 4: Running the ad without any CTA. Fix: Every lift ad should have one primary action — scan, call, or use code. Multiple CTAs dilute attention and tank conversion rates.
Mistake 5: Measuring too early. Fix: Allow a minimum of 4 weeks for statistically meaningful data, especially in the consideration-heavy categories (real estate, education, healthcare). Residents need repeated exposure before acting.
What a Full Tracking Setup Looks Like in Practice
Let’s say you’re a co-working space targeting freelancers and small business owners in a Mumbai residential micro-market.
Here’s your complete lift ad tracking stack:
- QR Code → Unique Bitly link → UTM-tagged landing page (
utm_campaign=lift-mumbai-q3) → GA4 goal: “Free Trial Booked” - Promo Code →
LIFTWORK10(10% off first month) → Tracked in CRM on deal creation → Field: “Lead Source = Lift Ad” - Call Tracking Number → Exotel virtual number → All calls logged → Tagged “Source: LiftUp Campaign”
- Landing Page → Society-cluster-specific URL (
yourbrand.com/bandra-west-offer) → Accessible only via ad - Week 6 Survey → 10-question WhatsApp form sent to residents → Brand awareness + intent data
At the end of 8 weeks, you pull together:
- 340 QR scans, 18% landing page conversion = 61 trial inquiries
- 22 promo code redemptions = ₹1,10,000 first-month revenue
- 14 call tracking leads, 7 converted = ₹3,50,000 in contracts
- Campaign cost: ₹85,000
ROAS: 5.4x — fully documented, fully attributable.
That’s not a vague “brand awareness play.” That’s a performance marketing result from an offline channel.
Why Most Agencies Can’t Do This (But We Can)
Standard outdoor advertising vendors sell you space. They hand you a banner slot and walk away. Measurement isn’t their job — it’s yours to figure out.
At LiftUp Marketing, tracking is built into every campaign from the brief stage. We help you:
- Define the right KPIs before we even design the creative
- Set up QR codes and landing pages that are GA4-integrated from Day 1
- Match your campaign to the right society profiles based on your customer avatar
- Run mid-campaign optimisation based on real scan and conversion data
- Deliver a post-campaign ROI report you can present to your board or investor
This is what separates a premium elevator advertising partner from a sticker-on-a-wall vendor.
Ready to Run a Lift Ad Campaign You Can Actually Measure?
If you’re a brand owner or marketing head who’s done spending budget on ads you can’t prove, let’s talk.
LiftUp Marketing will build you a fully tracked, conversion-optimised elevator advertising campaign — mapped to the exact residential societies where your target customers live, with QR tracking, promo attribution, and a clear ROAS framework in place from Day 1.
Get Your Customised Society List + Free Campaign Consultation
We’ll show you exactly which buildings in your target city fit your audience profile, what a realistic campaign ROI looks like for your category, and how we track every rupee you spend.
No fluff. No guesswork. Just lift advertising that’s built to perform — and built to prove it.
LiftUp Marketing specialises in premium residential elevator advertising across India’s top cities. To explore campaigns tailored to your brand, visit www.liftupmarketing.in or WhatsApp us directly.